As we know to validate theoretical solution or new product design, we need to conduct actual trials. These experiment trials we conduct to observe the impact of various input variables on output variables. Before implementing the solution on commercial scale, it is better to check them at pilot scale. This way we can avoid any flaws and gaps in our design and revenue loss after commercializing it. More variables need more trials and it mean more money. Therefore, Design of Experiments is used to bring down the number of experiments needed to validate.
Using Design of Experiments or DOE tool, we can find out the best set of variables, which will give us maximum output. Let us take an example for batch reactor to understand the complete process to conduct a DOE.
Table of Contents
Details of Batch Process
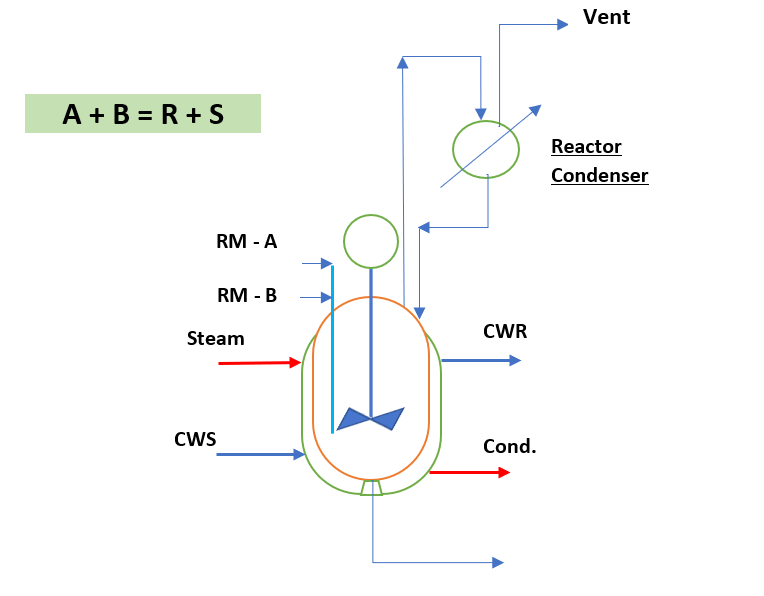
Our reactor has two input raw materials RM-A and RM-B. This is a non-catalytic liquid phase reaction and reaction temperature is 120 0C. The reaction pressure is 2.5 bar. During reaction product ‘R’ forms and ‘S’ is by product which is not desirable. RM-A is limiting reactant and conversion is 100%. While RM-B is 1.5 times of RM-A in feed. Reaction is exothermic and reactor temperature is controlled by cooling water circulation in reactor jacket and reactor condenser. Also, this reaction is taking place in solvent and evaporative cooling is used. Batch cycle time for reaction is 6 hrs, which varies batch to batch. Finally, the yield of product ‘R’ in reaction product is in the range of 80 to 85%.
Baselining for the Reactor Yield
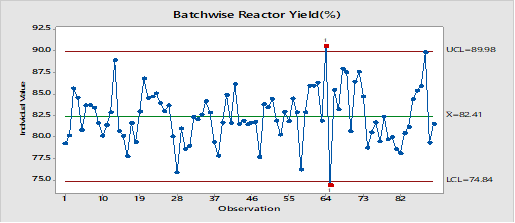
For setting baseline, we have collected the yield data for last 90 batches. Baseline is the average of data points after elimination of special cause variations. Special cause variations are those one for which there is an assignable cause. These can be such as plant shutdown, breakdown, power failure, etc.
Below is the individual control chart for the reactor yield data, in this baseline yield is 82.41%. However, two data points are outliers but in the absence of some assignable cause we will include them in our baseline calculation.
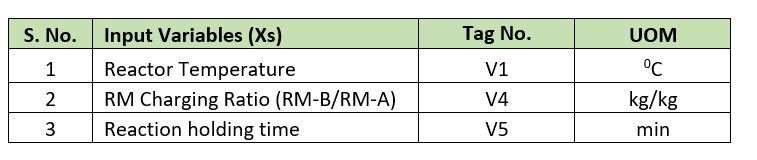
Identification of Predictors
Now we will identify the predictors for our response variable, which is the yield of product ‘R’ in this case. We also know predictors as independent variables, input variables or Xs factors. We can call response variable by the name of dependent variable or output variable also.
For the identification of independent variables for our response we need to conduct a brain storming session with cross functional team. The participant can be plant manager, R&D scientist, process design engineer, six sigma black belt, instrumentation engineer, electrical engineer etc. Using brain storming and Fish Bone Diagram we can identify all the various possible predictors which affects our reactor yield for desired product. The result can be as below.
Various Terms Used in DOE
- Experiment: This is the setup and systematic procedure of collecting data in a structured format for analysis to validate the effect of input variables and their interactions. It is important that, this experiment is conducted in controlled environment where output is stable for the given set of input conditions.
- Response or Outcome: This is the output of the experiments for a given set of inputs and system parameters.
- Factor (x): These are the input and system parameters which we change as per our experiment requirement. In our experiments these will be different for different trials. In our example above three input variables are the factors.
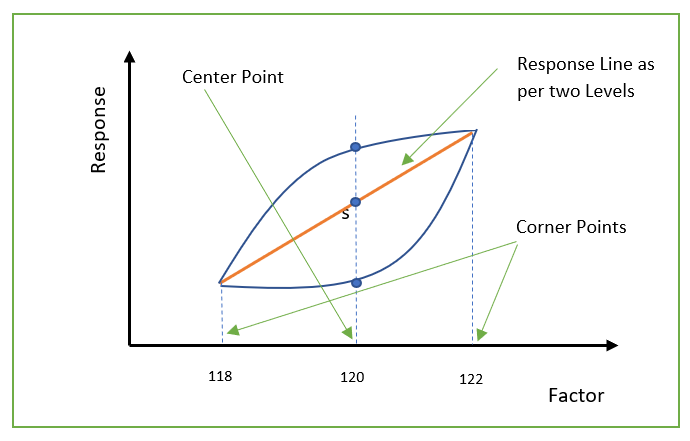
- Levels of a Factor: In DOE levels are the alternative values of a factor. Like for rector temperature Factor we can have 118 and 122 0C two levels. Two level tells about effect of end points on the response. This is good in case of if response is straight line. We can have center point levels also where we have one midpoint temperature (i.e., 118, 120, 122 0C) also. Therefore, using center point we can see the effect of curve also (i.e., nonlinear response). As we can see in below figure.
- Replication: In DOE Replication means repeating all the experimental parameters two or more times, in a randomize manner. It means repetition should not be done back to back, to avoid biasness. If we conduct trial one time only then it means there is no replication.
Factors and Levels
For our case we have three Factors and we will conduct the experiments on two levels. We will replicate our experiments for two times. The below table shows our factors with levels.
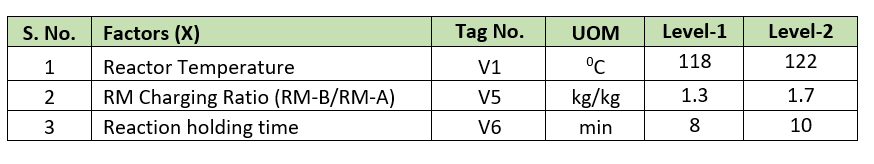
We will consider Full Factorial design for our case having two replicates. Therefore, total number of experiments will be (Replicate*2Factor )= 2 * 23 = 2 * 8 = 16. Here we can see if factors are 4 we will have 32 experiments and with 5 numbers of experiments will go up to 64 numbers. Therefore, in such cases where variables are more than 4 we should use fractional factorial or Taguchi method. This method reduces the required numbers of experiments drastically.
Creating Design in Minitab
You need to install Minitab software to do further design and analyse the experiments. You can install 30 days trial Minitab version form their site. I will show you step by step process as below:
To create a design, follow below link
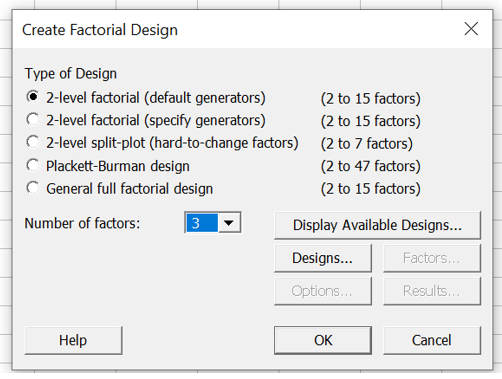
Stat > DOE > Factorial > Create Factorial Design
Select type of design and number of factors as 3 numbers and click on Designs.
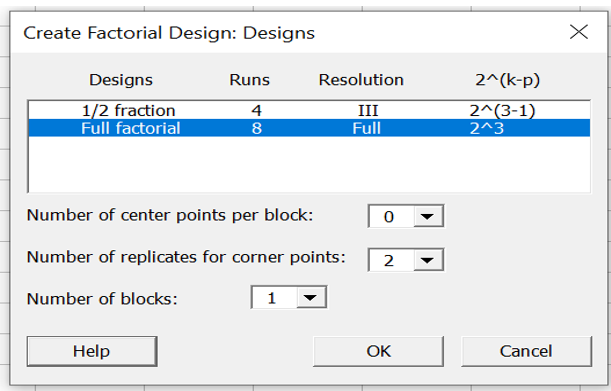
Select Full factorial and numbers of replicates for corner points only. And, keep numbers of block 1 then click OK.
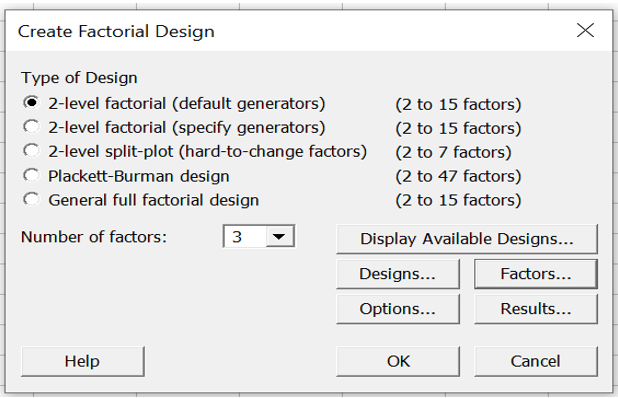
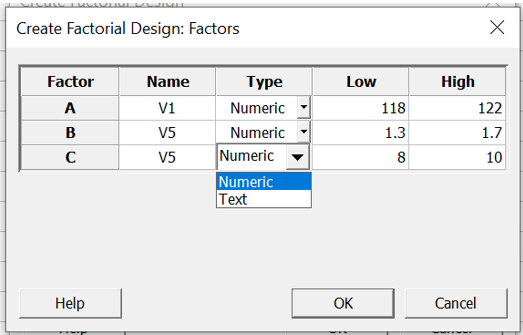
After clicking OK we will get below screen. Subsequently, Factors button is activated and click on it to enter the levels for factors.
Enter the factor names in Name column (I have mentioned in it tag nos.). Enter the Type of factor whether it is numeric or text. Afterwards, input the values of Low and High Levels. Then click on OK.
After click OK again click on OK you will get the table of design for experiments, as below:
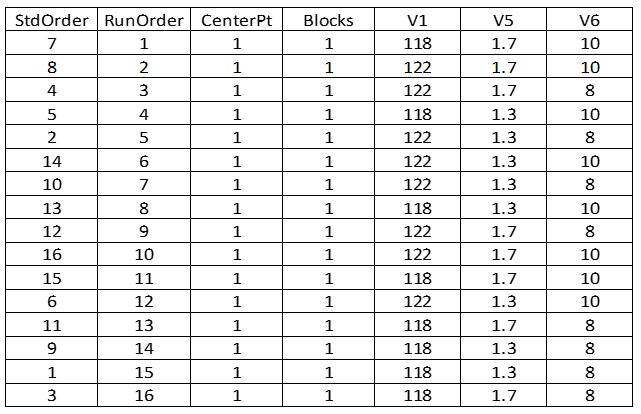
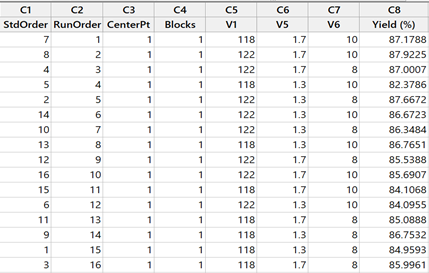
Now you need to run your experiments for given sets of input as given in above experiment table. Subsequently, after getting results from the trials enter values in %Yield column as shown below.
In next step we will analyse our DOE (design of experiments) to fit a model. So, follow the below link
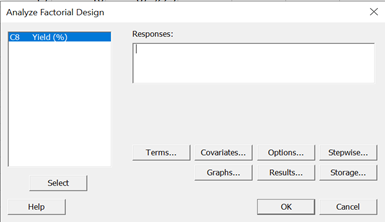
Stat > DOE > Factorial > Analyze Factorial Design
Now here select our response and click OK.
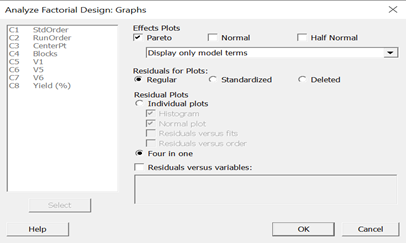
Click on graphs and select Pareto and Four in one Residual Plots as shown below.
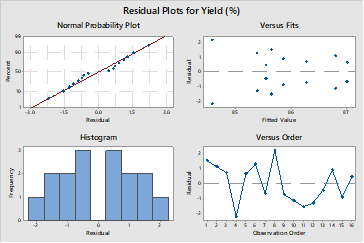
After click OK, we will get below Residual Plots and Pareto Chart. In residual plots we can check normality test for residuals. Therefore, residual are remaining common cause variations in the response. You need to ensure that the variation of residual is normal or not.
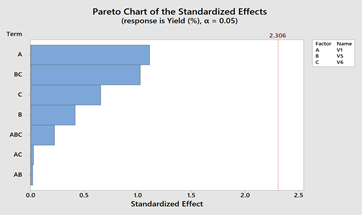
In Pareto chart we can see the standardized effects on Yield. Here A (V1), BC (V5 & V6) and C (V6) is affecting the reactor yield most.
Next, we will go through the main effect plots. For this we follow below link
Stat > DOE > Factorial > Factorial Plots
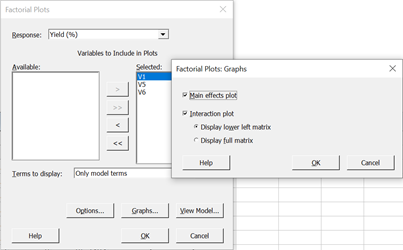
Select Main effect plot & Interaction plots and Click OK we will get below plots.
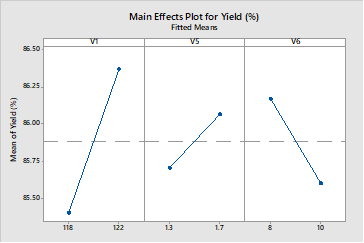
Main effect plot shows the effect of individual factor variation on reactor yield. In main effect plots we can see increase in reactor temperature and RM ratio affect the yield in proportional manner. While, reaction material holding time affects the yield in inversely proportional way. Therefore, for better yield holding reaction material for higher time is not good. It can be because of charring or more by-product formation. At 8 hrs holding time yield 86.12% and for 10 hrs holding it is 85.25%.
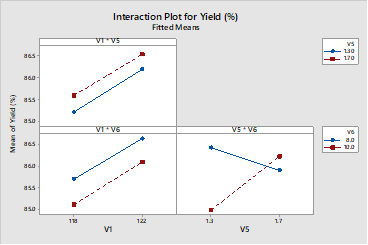
Interaction plots are as below which shows the combined effect on reactor yield.
Summary of Steps to Conduct DOE
To conduct a successful Design of Experiments you can follow below steps
- Define the Problem – First of all it is very important that we have a clear problem statement to conduct the DOE. As in our hypothetical case our problem is “The Reactor Yield is Low.”
- Establish the Objective – You need to set the outcome of your DOE. For example, in above case it is “Maximization of the Reactor Yield for Desired Product.”
- Select the Response & Factors – as we did above our response is the yield of product ‘R’ and Factors are from V1, V5 & V6.
- Choose the factor levels – here we set our factor levels on which you will run the experiments. In our case we have considered two levels (i.e., low level & high level).
- Select the experimental design – We need to select which DOE method will be good for our requirement. We have selected full factorial method; in case of more variables you can select partial factorial using Taguchi method. Moreover, other method is RSM or Response Surface Method.
- Collect the data – After preparing experiment run table, you need to conduct the actual experiment and collect the data for your response. For example, in our case we got the product yield data for each experiment run.
- Analyse the data – after getting response data from actual experiments, which we have run. Enter into the Minitab Design and analyse the model. Subsequently, after study the output like pareto chart of the effects & residual plots. Draw conclusions about the effect of factors and their interactions on response variable.
- If needed run additional experiments to achieve your objectives.
Conclusion
You can use DOE tool to get set of parameters which can maximize the response. Also, you can use DOE for the designing a new processes or products. This helps to correlate the process variables with product characteristics. Moreover, you can use it to compare different processes, machines, material etc.
We need to understand the various reasons for design of experiments failure also. These can be, like you are not clear what do you want from experiment. Simultaneously, the error in parameter measurement during experiments. Many times, you may miss very important factor or very few factors considered in DOE. Apart from these, other possible reasons for DOE failure can be lake of proper planning, management support, non-availability of resources and capex for adequate experiment trials.
Thanks for reading, looking forward for your feedback and comments. Also, please don’t forget to subscribe my future posts.