This article is to understand the data analysis in chemical process improvement in chemical process industries. As, we all have witnessed industrial development from manual operation to fully automated controlled one. Plant operations and controls have gone under tremendous transformation since then. Mainly, we can categorize this transformation in four major heads as,
- Analog and paper-based control system
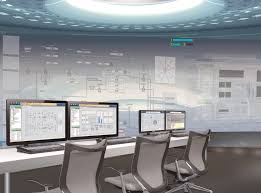
- Distributed Control Systems / PLC
- Advance Process Control of Multi Variable Control
- Big Data / AI / ML/IIoT
Our DCS, PLC and IIoTs are generating continuously huge amount of data, which is very valuable. In past because of unavailability of enabling technologies to store and process this Big Data were note there. But now there are technologies available to analyse and store this data (i.e., cloud and data lakes, internet connectivity and mobility)
Advance process control (APC) is the foundation for successful digital transformation. The digitalization of chemical industry can be a turnaround step through improving process controls using Artificial Intelligence, Machine Learning and more robust Data Science Modelling.
Implementation of APC and Digitalization will benefit the industries by
- Increase in profitability and revenue (by reduction in process variations and predictive modeling)
- Efficiency of process will increase by real time data analysis
- Increase in reliability, it starts with the target of safe, stable operations and meeting environmental regulations
Available data in our plant from DCS/PLS can be analyzed to get meaningful and valuable insight. The outcome of data analysis can utilized in making fast and accurate decisions to manage and control our processes efficiently and effectively. Various steps to analyze the data one can follow below steps:-
Plot Your Data
To get the insight and to understand the behavior of our process, first step is to plot the data. We can visualize the data using tables, scatter plot, time series plot, bat plot, box plot etc.. Our data can be anything like Reactor Yield, Steam Consumption, Power Consumption, Coal Consumption in Boiler, Make Up/Blow Down in Cooling Tower etc.
See The Variation
After plotting the data second stage is to study the data. To analyze the data one can use various technics like Descriptive statistics and Inferential Statistics (Histogram and probability, Paired tests (Z-test, T-test), etc.), to get the information like:
- Type of data distribution and it’s variation
- Yesterday our yield was less than 60%, what are the chances of that happening under standard conditions
- We have historical failure rate data of the pumps mechanical seals in as particular zone. What is the probability that 3 pumps will fail this month?
- Does distillation-1 stream has better final product quality on average than distillation-2?
All this process variation is although a good opportunity to keep us process engineers employed to control and maintain them all the time, but this comes at a price to the company. As any process variation beyond certain limits increases raw material and utility norms, which in turn eats away the profit of our company.
Customers looks for both low cost and low variation in the product they purchase. In case of variability in the process it is not possible to meet customers requirements and in some cases it leads to the big business loss also.
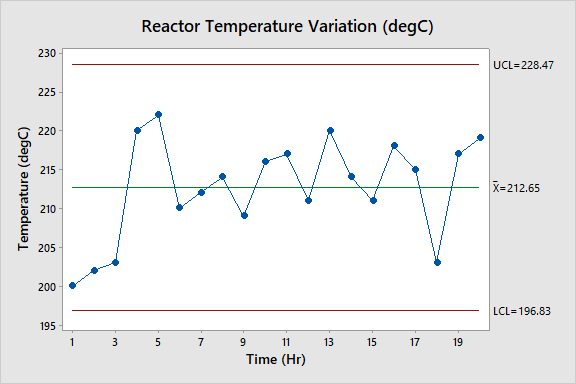
Process Monitoring and Control
After plotting and analyzing the variation, we get the insight to understand the impact of variation. So we need process monitoring and process control in place. These systems are easily implemented online and generate great value for companies, that is used in day-to-day production. Monitoring charts are a graphical tool, which enable us to rapidly detect the problems by visual analysis.
Conclusion
Data analysis in chemical process improvement is very helpful and important tool to improve and optimize our process. Before arriving to any conclusion of a standing problem data analysis is must. Problems in our plant can be such as low yield of reactor, high energy consumption in distillation, huge variation in make up water in Cooling Tower, etc.. So, data analysis can enable us to find out the root cause of the problem. Moreover, implemented solution will improve the process effectively and efficiently.
Thank you very much for your reading, please submit your comments for further improvements